Adjusted comp by comp
Each comp is adjusted from its own contract date. In one report, some adjustments can be positive, some negative and some zero.

MarketAdjuster
Each comp is measured from its own contract date to your effective date. Some get an adjustment and some don't, and the report shows which is which.
Needs: Address · Zip · Pending Date · Sold Price · Sample market included to try it on
Most market conditions adjustments are one monthly percentage applied across the whole grid. That assumes every comp sold in the same market, and they didn't.
Each comp is adjusted from its own contract date. In one report, some adjustments can be positive, some negative and some zero.
A chain-linked index with a smoothing window and a confidence band, and a list of the outliers excluded and why.
Smoothing window, minimum sales per month, no-adjustment window and minimum adjustment. Change any of them and the results update.
You load one export and get an adjustment for each comp, with the chart and the UAD 3.6 section attached. The figures below are from the sample market included with the app, so you can open it and follow along.
Two fields. Every comp is measured back to the effective date, and saved reports reopen with everything intact.
Subject
| Effective date | Sep 05, 2026 |
| Recent reports | searchable |
For a revision request, you reopen the report. You don't rebuild it.
The closed sales from your competitive market. Column names don't have to match. If the app can't place a column, it asks you instead of guessing.
Recognized automatically
| Address, Zip | required |
| Pending Date, Sold Price | required |
| Asking Price, Status, DOM, concessions | read |
Leave actives and pendings in. They fill the UAD 3.6 market section.
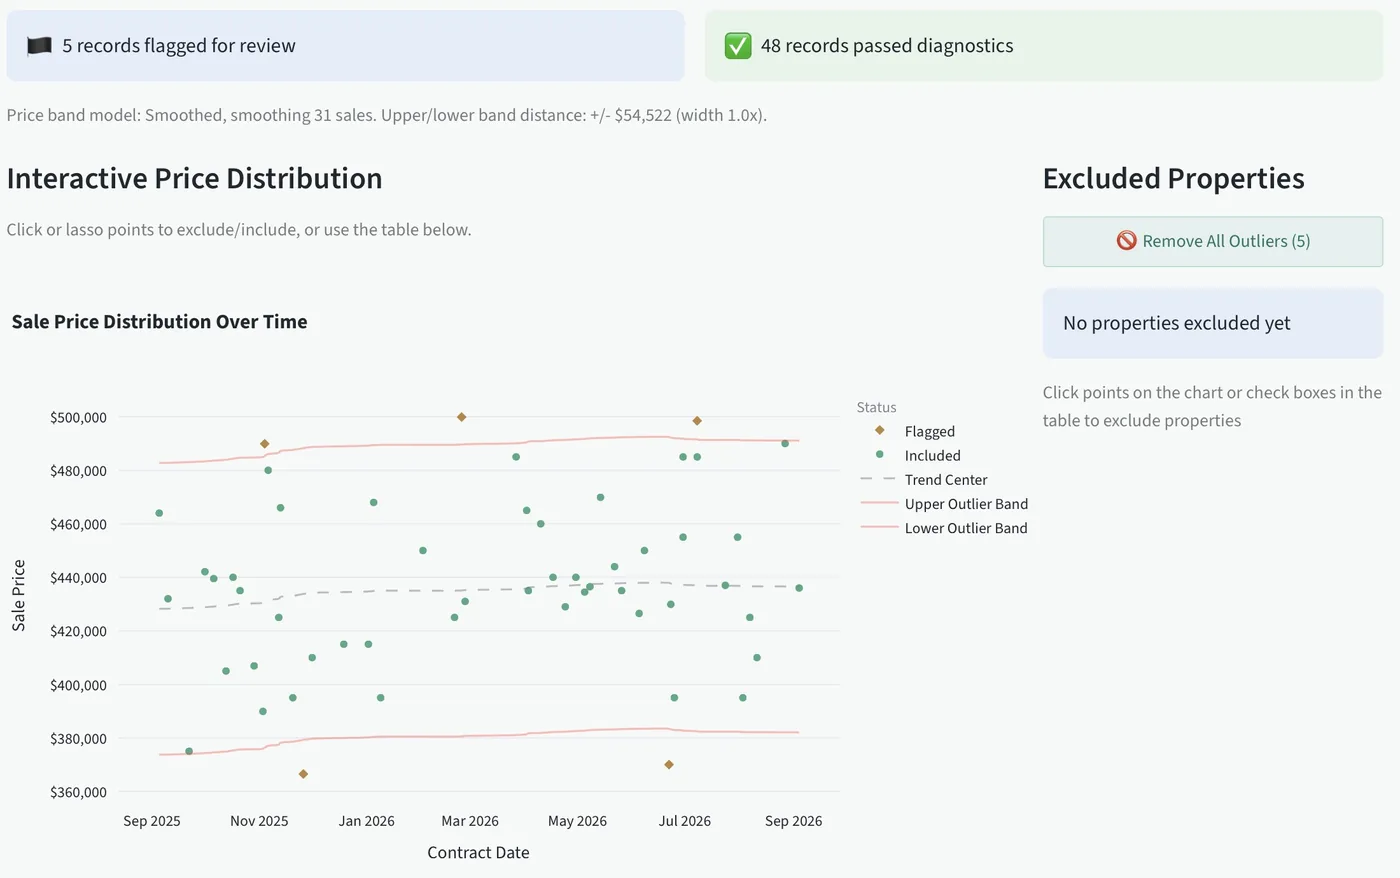
Every sale is plotted against its contract date, with outliers flagged for review. A flagged sale stays in the analysis unless you take it out.
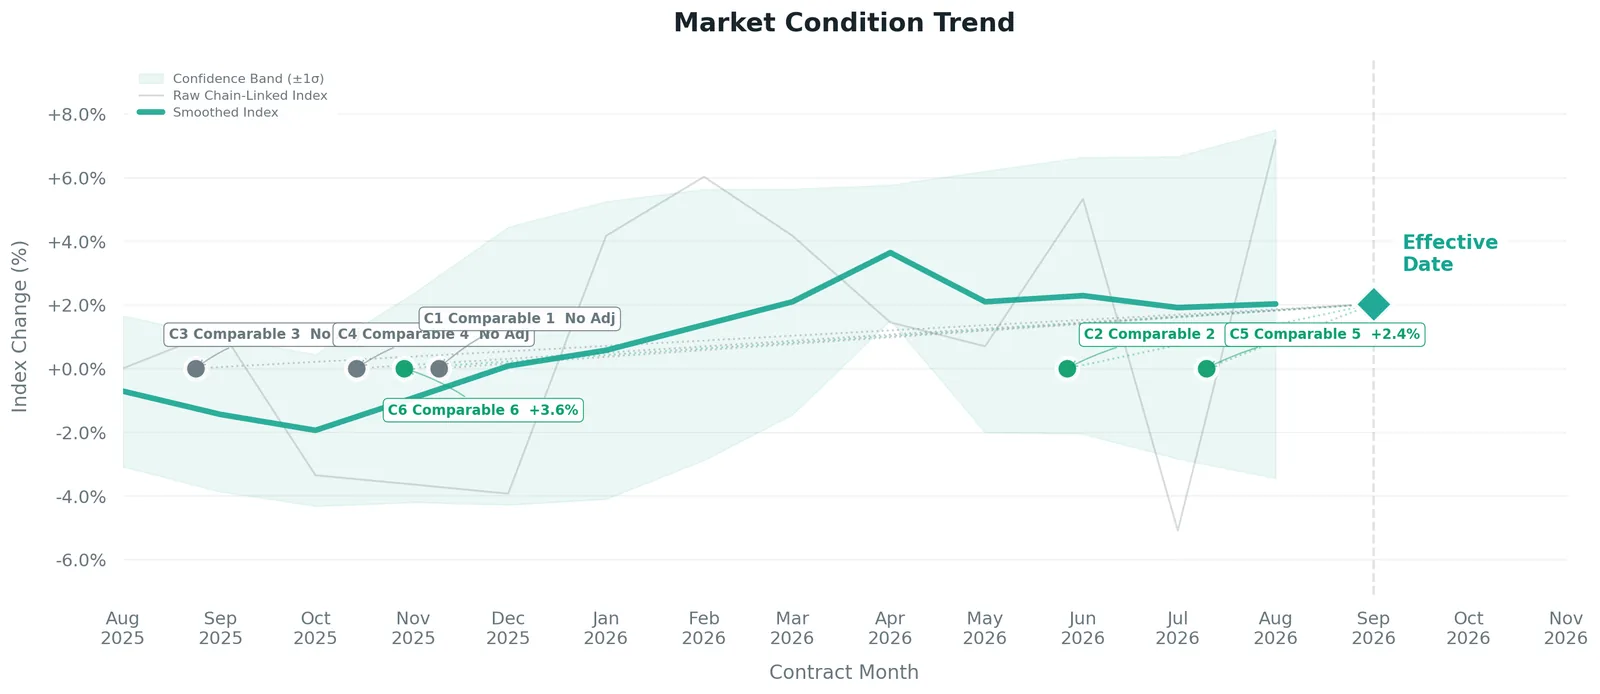
The trend comes from the whole market. These are the six comps that get adjusted, each on its own contract date.
Market context
| Overall market change | +4.20% |
| Index at effective date | 1.0301 |
| Data quality | 53 sales |
Search and check off comps to build the list, then reorder the rows so Comp 1 here matches Comp 1 in your forms software. Overall change describes the whole period. Each comp's adjustment depends on where its own contract date falls.
Two comps get an adjustment and four fall inside the no-adjustment window, all from one data set. That's what Fannie Mae guidance asks for, and it's why the report shows a table instead of one percentage.
There are two buttons at the top, the same as in CompAdjuster: the PDF for the report, and chart images you can drop straight into it. The workfile pack, UAD section, narrative and raw data are tucked away until you need them.
Built for UAD 3.6
The redesigned URAR wants the market described in structured fields instead of a paragraph. MarketAdjuster fills in all of them from the export you already pulled, in the order the new form asks for them.
It's just as useful on a 2.6 report today, where the same figures still need support. The layout, field names and concession detail follow UAD 3.6, so you won't have to redo the work when the new form arrives.
Fannie Mae B4-1.3-09 allows a dollar-for-dollar concession adjustment only when your analysis supports one, and doesn't accept an automatic deduction of what the credit cost the seller. Most reports cover this with one sentence. MarketAdjuster measures it.
Sales with a reported concession are compared with sales reported to have none, based on how each one closed against its list price. The dollar difference between them is what the market paid for the credit.
The result is reported with the range around it, so you can see whether it's a real finding or a coin toss. If the estimates don't agree on direction, it says no adjustment is indicated instead of giving you a number.
Adjust at the measured rate, at the conservative end of the supported range, or not at all. Your choice is recorded in the commentary, and adjustments are rounded to the nearest hundred, the way you'd write them.
If concessions are common but don't measurably affect price, that's worth reporting. "No concession adjustment, and here's the support" holds up better than saying nothing.
Concessions are called prevalent above a share of closings you choose, and flagged to watch above a second, lower share. The defaults are 50% and 10%, and you can change both on any report.
Fannie Mae B4-1.3-09 says the adjustment isn't based on how common concessions are in the area. So the prevalence label describes the market, and the measured effect decides the adjustment. The two are kept separate on purpose.
Common layouts are recognized automatically. If a required column is missing, the app tells you which one instead of failing quietly. If your board's export is unusual, send it over and we'll add it.
The exhibit shows the data set, what was excluded, the method and the reasoning, so a reviewer can follow how you got the number instead of taking it on faith. MarketAdjuster's narrative cites Fannie Mae Selling Guide B4-1.3-09 on adjusting each comp from its own contract date. No software can promise a particular reviewer will accept a particular report.
It covers what the 1004MC asked for and more. The old form wanted median price, days on market and inventory over three periods. MarketAdjuster measures the trend across every closed sale, tests whether it can be separated from flat, and turns it into a rate applied to each comp from its own contract date. It also fills in the UAD 3.6 market section, which replaced the 1004MC.
No. It doesn't fill out a URAR and won't. It works out the rates and writes the support. You enter the concluded figures on the grid in the forms software you already use, whether that's TOTAL, ACI, ClickForms or Aivre. It works alongside that software.
The redesigned UAD 3.6 report doesn't change that. Whatever forms software you use, the new report asks for more visible support behind each rate, not a different way to derive it. The rates still have to come from your own market, and that's what this does.
No. They're sold separately and neither depends on the other. They take different exports and answer different questions: time adjustments versus physical ones. Most people who start with one add the other later.
Your uploads are processed for your analysis, and your saved reports are stored in your own account so you can open them on any computer. Your data isn't sold and isn't pooled into anyone else's analysis.
No. The analysis is math you can follow: medians, a chain-linked index and a regression check, all run on the sales you provide. Nothing is guessing at a number, because an adjustment you can't explain isn't support.
See also UAD 3.6 support.
Per appraiser. Every plan starts with 14 days free. Nothing's charged before day 14, and you can cancel anytime from your account page.
Complete adjustment support
or $699/year · $9 a month less than both separately
Notify meAt $69 a month, Professional costs about what 40 minutes of an appraiser's time is worth. That's 40 minutes a month, not per report. Run your own numbers.
More than one appraiser in the office? Tell us how many and we'll price it for your office.
AppraiserBench opens to all appraisers on October 1. Leave your email and we'll send you the link that morning.
Prefer email? [email protected]